


Track Scope 1, 2 and 3 emissions in real time, engage attendees with live sustainability insights and generate credible carbon reports from one event-ready platform.
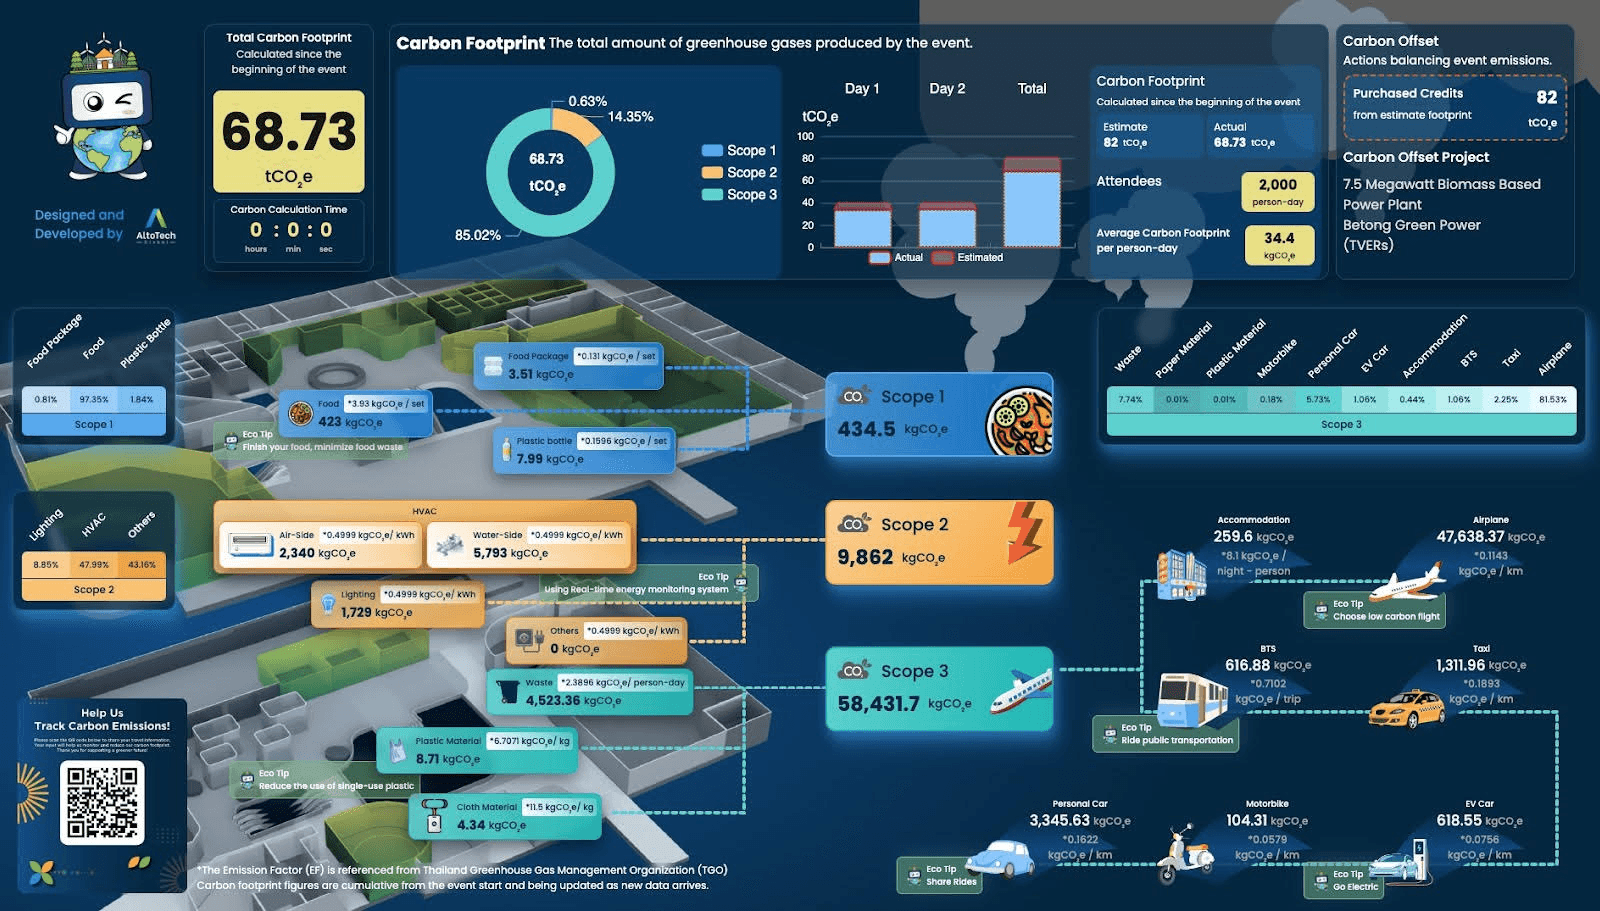
Emissions by Scope
Promotes eco-friendly consumption from food and beverages.
Helps monitor HVAC systems (air-side and water-side), lighting, and other electricity usage.
Educates visitors and encourages greener travel lodging choices and waste reduction practices.
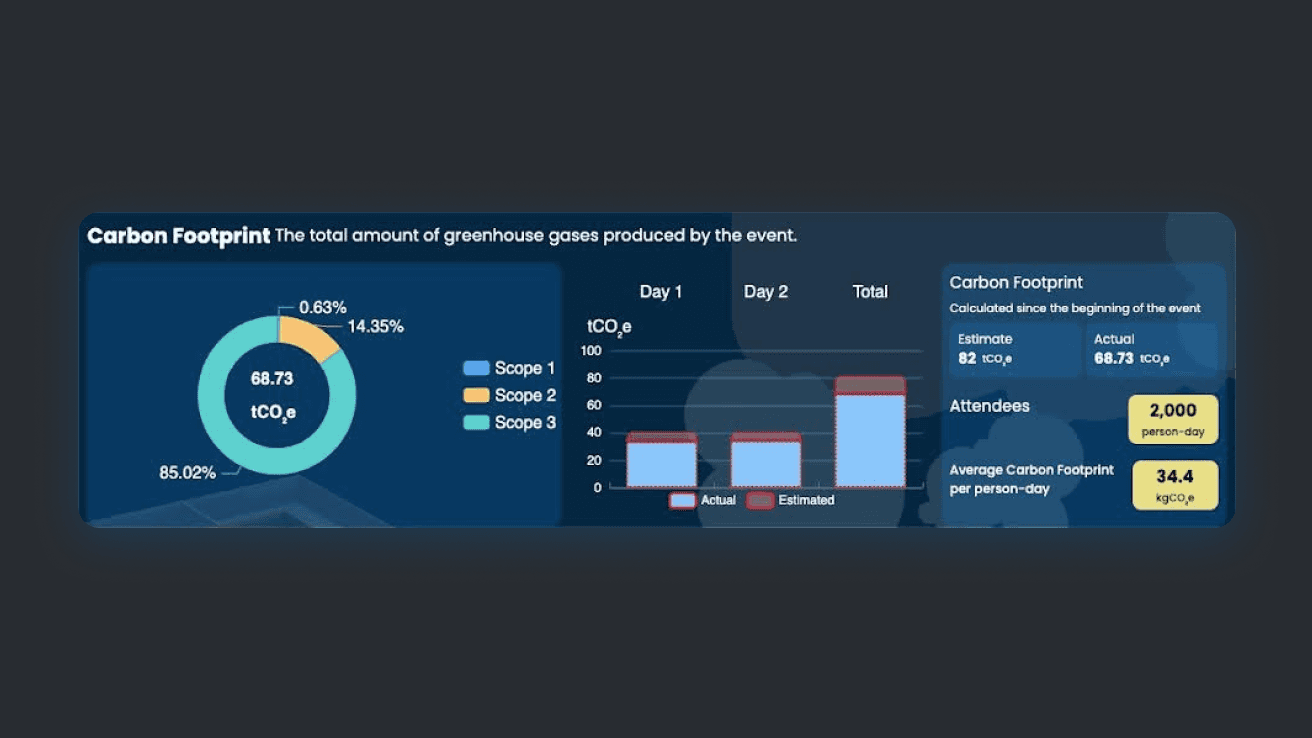
Carbon per Attendee Analysis
Raises individual awareness and promotes personal accountability.
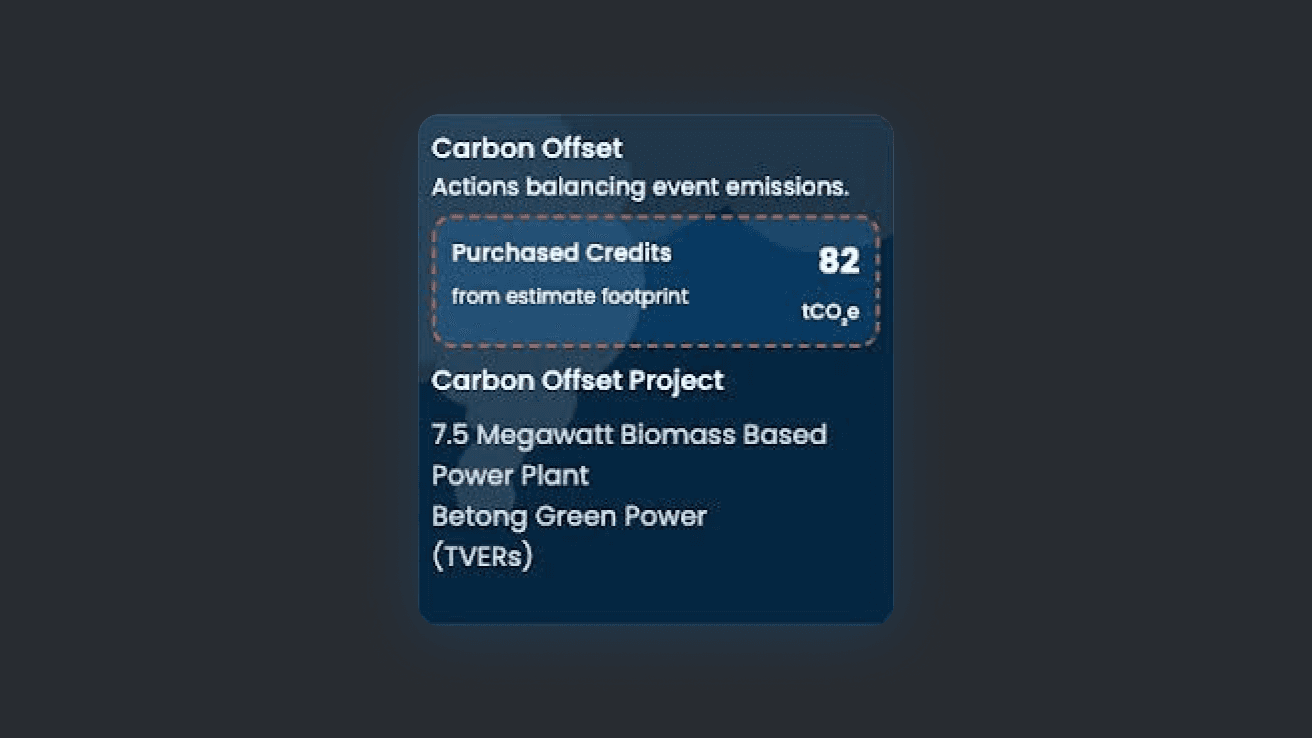
Carbon Offset Tracker
Validates carbon neutrality commitments and builds trust through transparency.
QR Code for Easy Dashboard Access
Quick visitor access to share transportation for emission tracking
Carbon Tracking Platform for Event
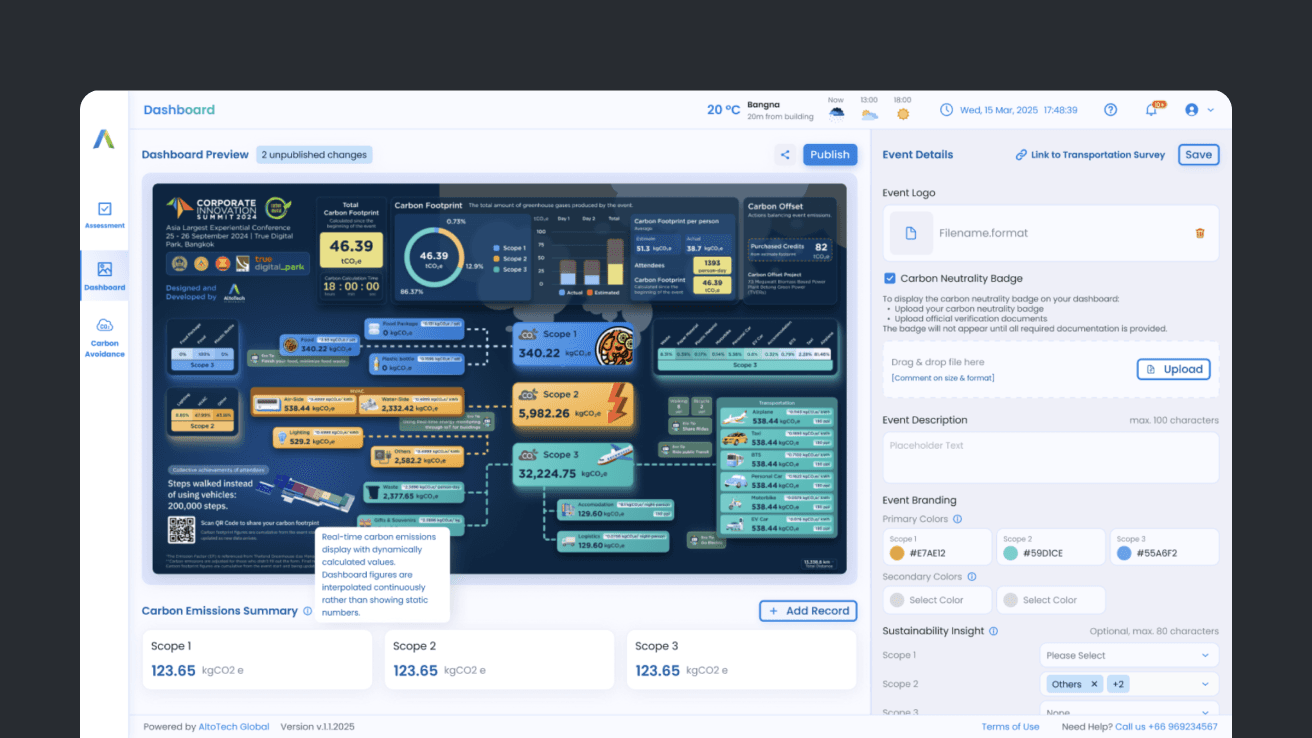
Dashboard Appearance Customization
Personalize dashboard identity, logos, colors, and sustainability messages.
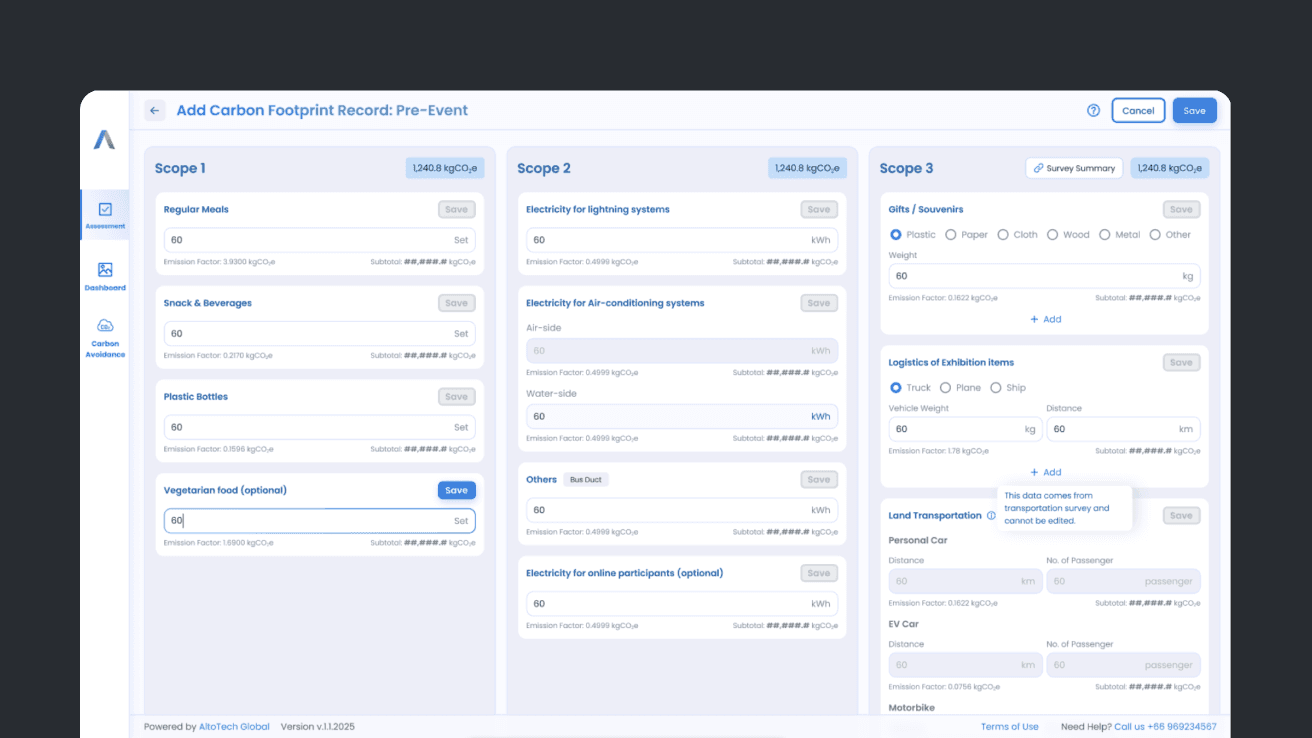
Carbon Tracking Platform
Allows users to manually input event-specific data required for Scope 1 and Scope 3 emissions for both pre-assessment and post-assessment.
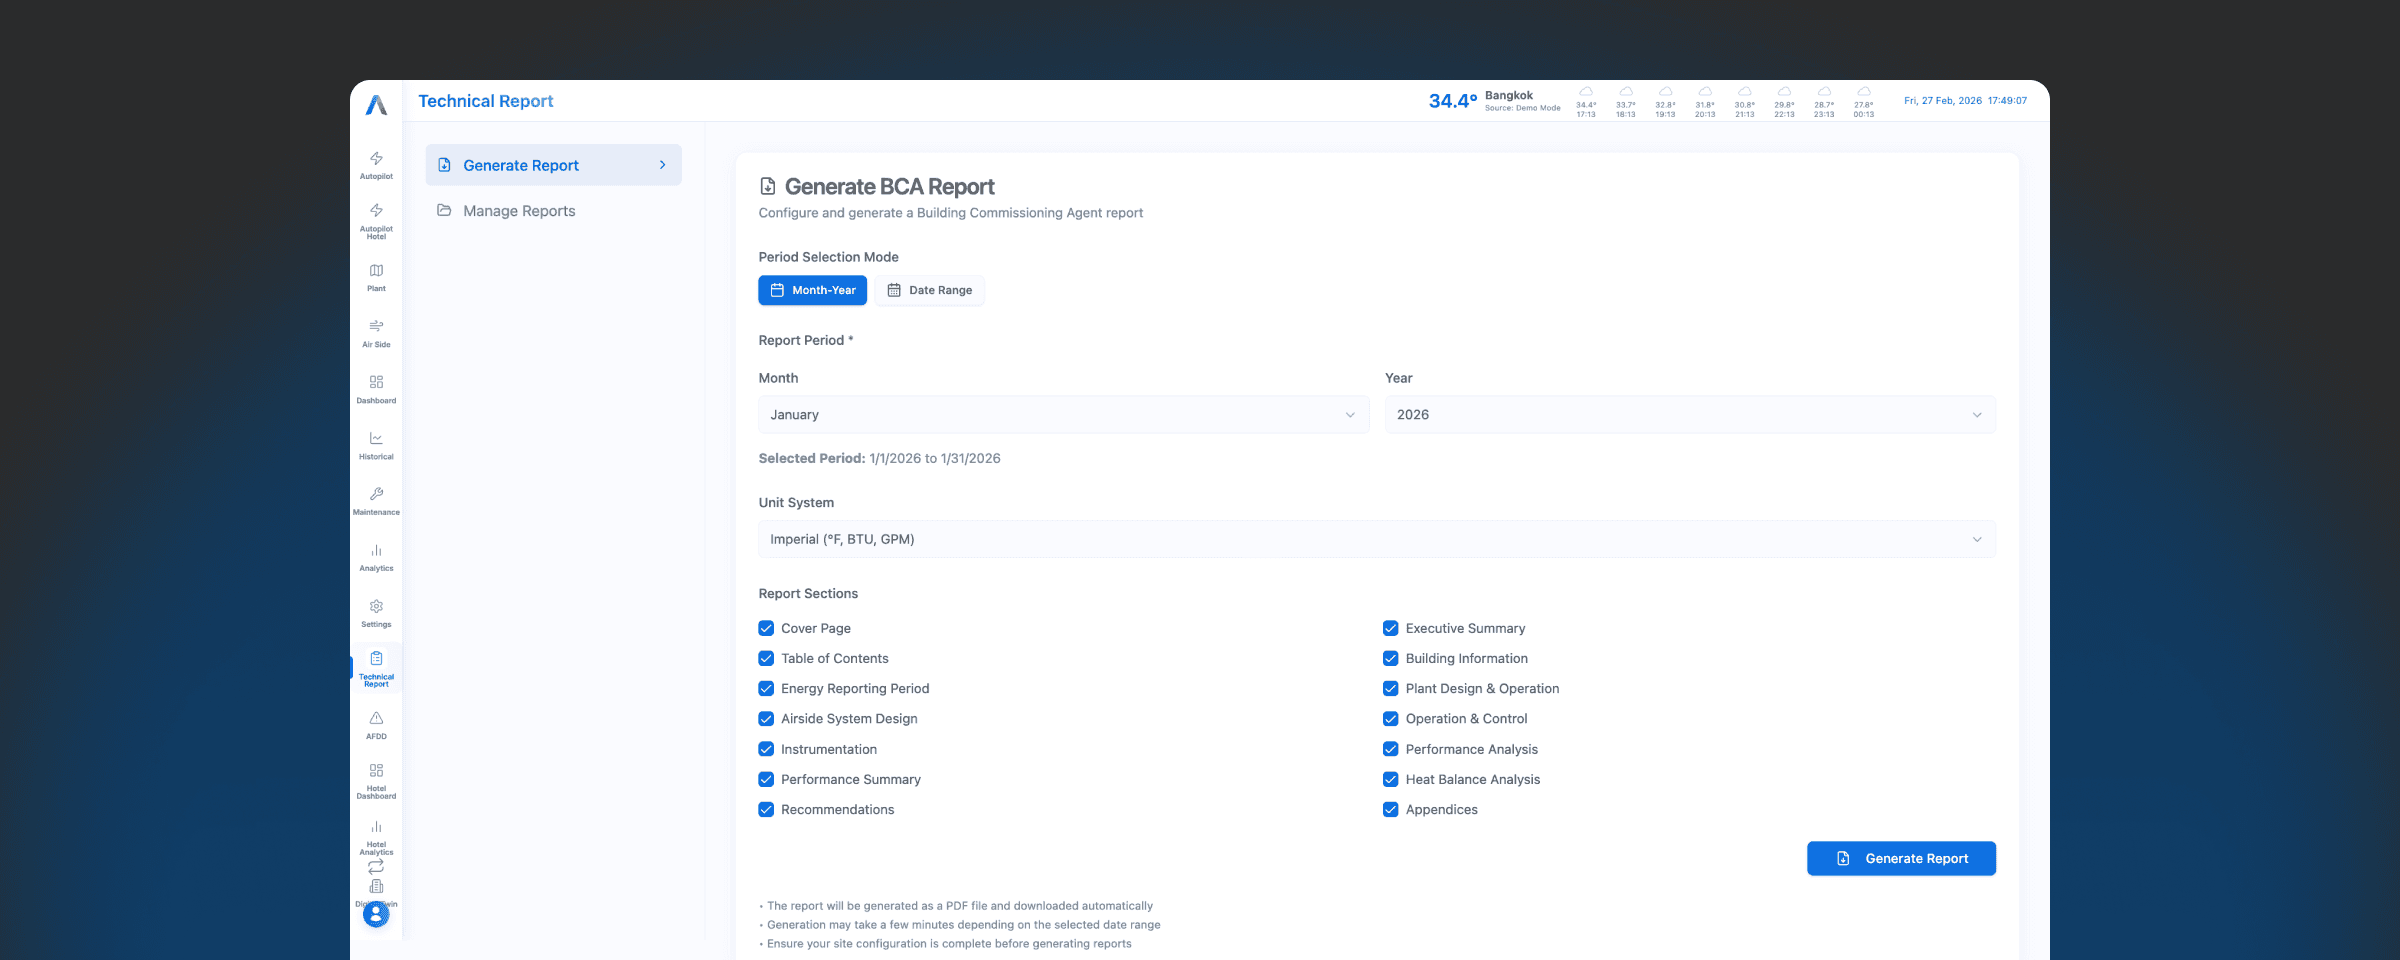
Carbon Report Generation
Monitors live carbon emissions data (Scope 1-3) and report generation.
Coming soon
Carbon Credit Marketplace
Recommend verified carbon credit projects to help achieve certified carbon neutrality.
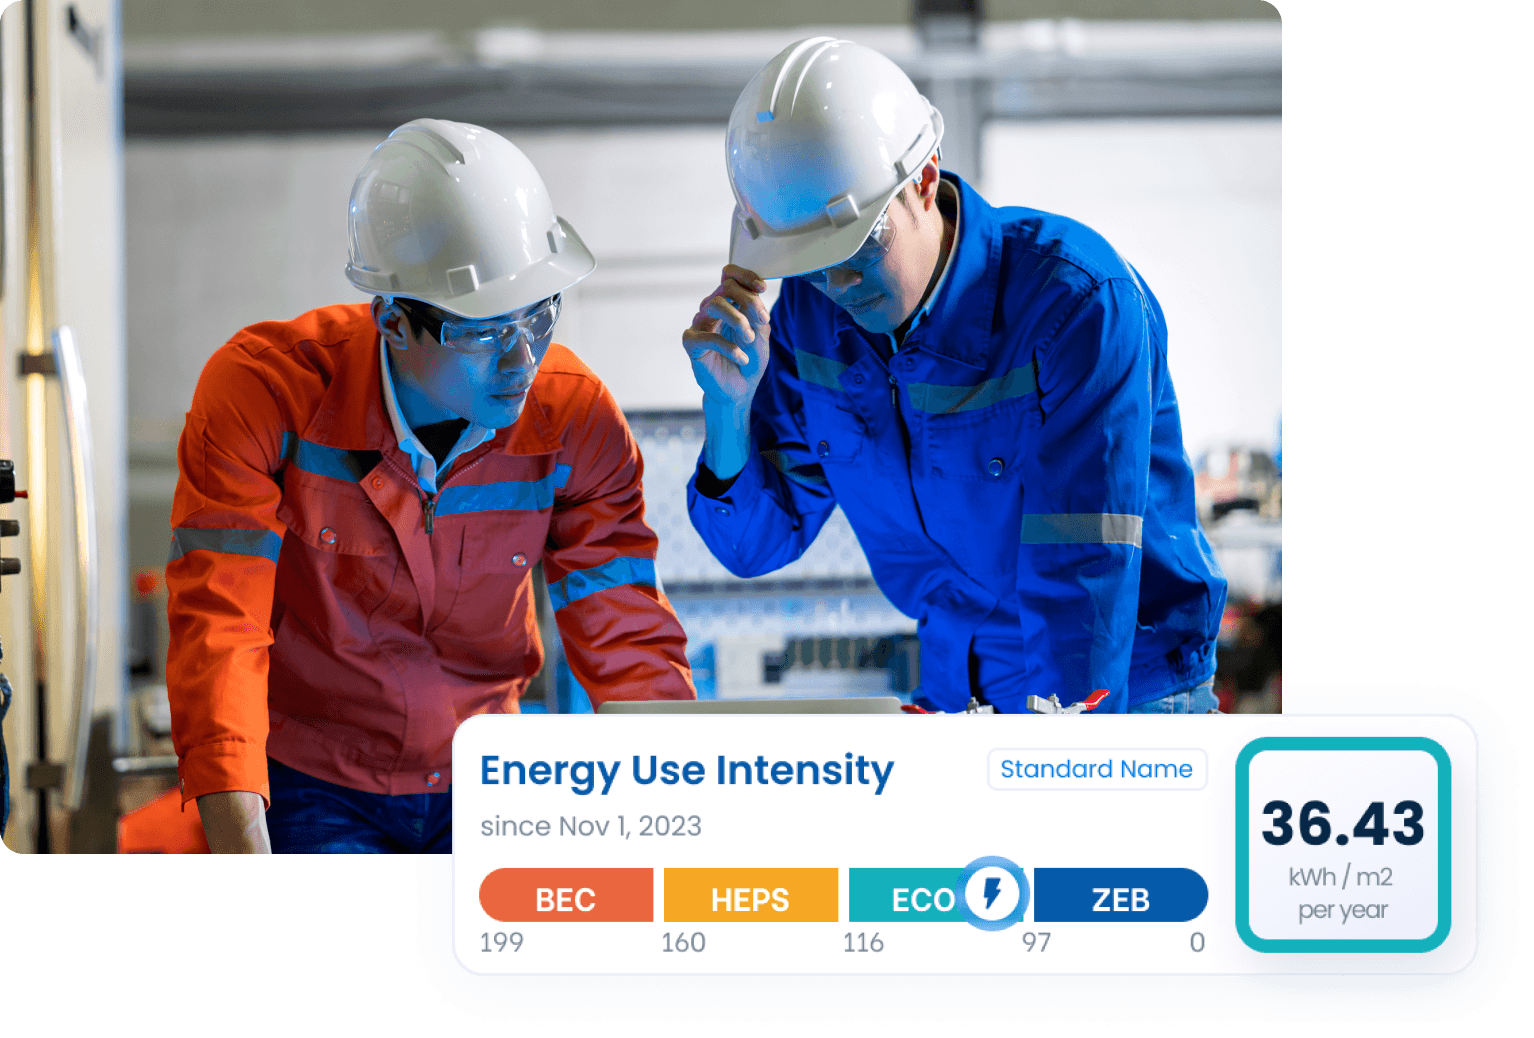
Carbon Dashboard measures; Alto CERO reduces. Pair real-time carbon accounting with AI-driven HVAC and chiller-plant optimization to turn reporting into actual reductions.
Explore how organizers and venues have used live carbon tracking to measure emissions, engage visitors and demonstrate credible sustainability performance.


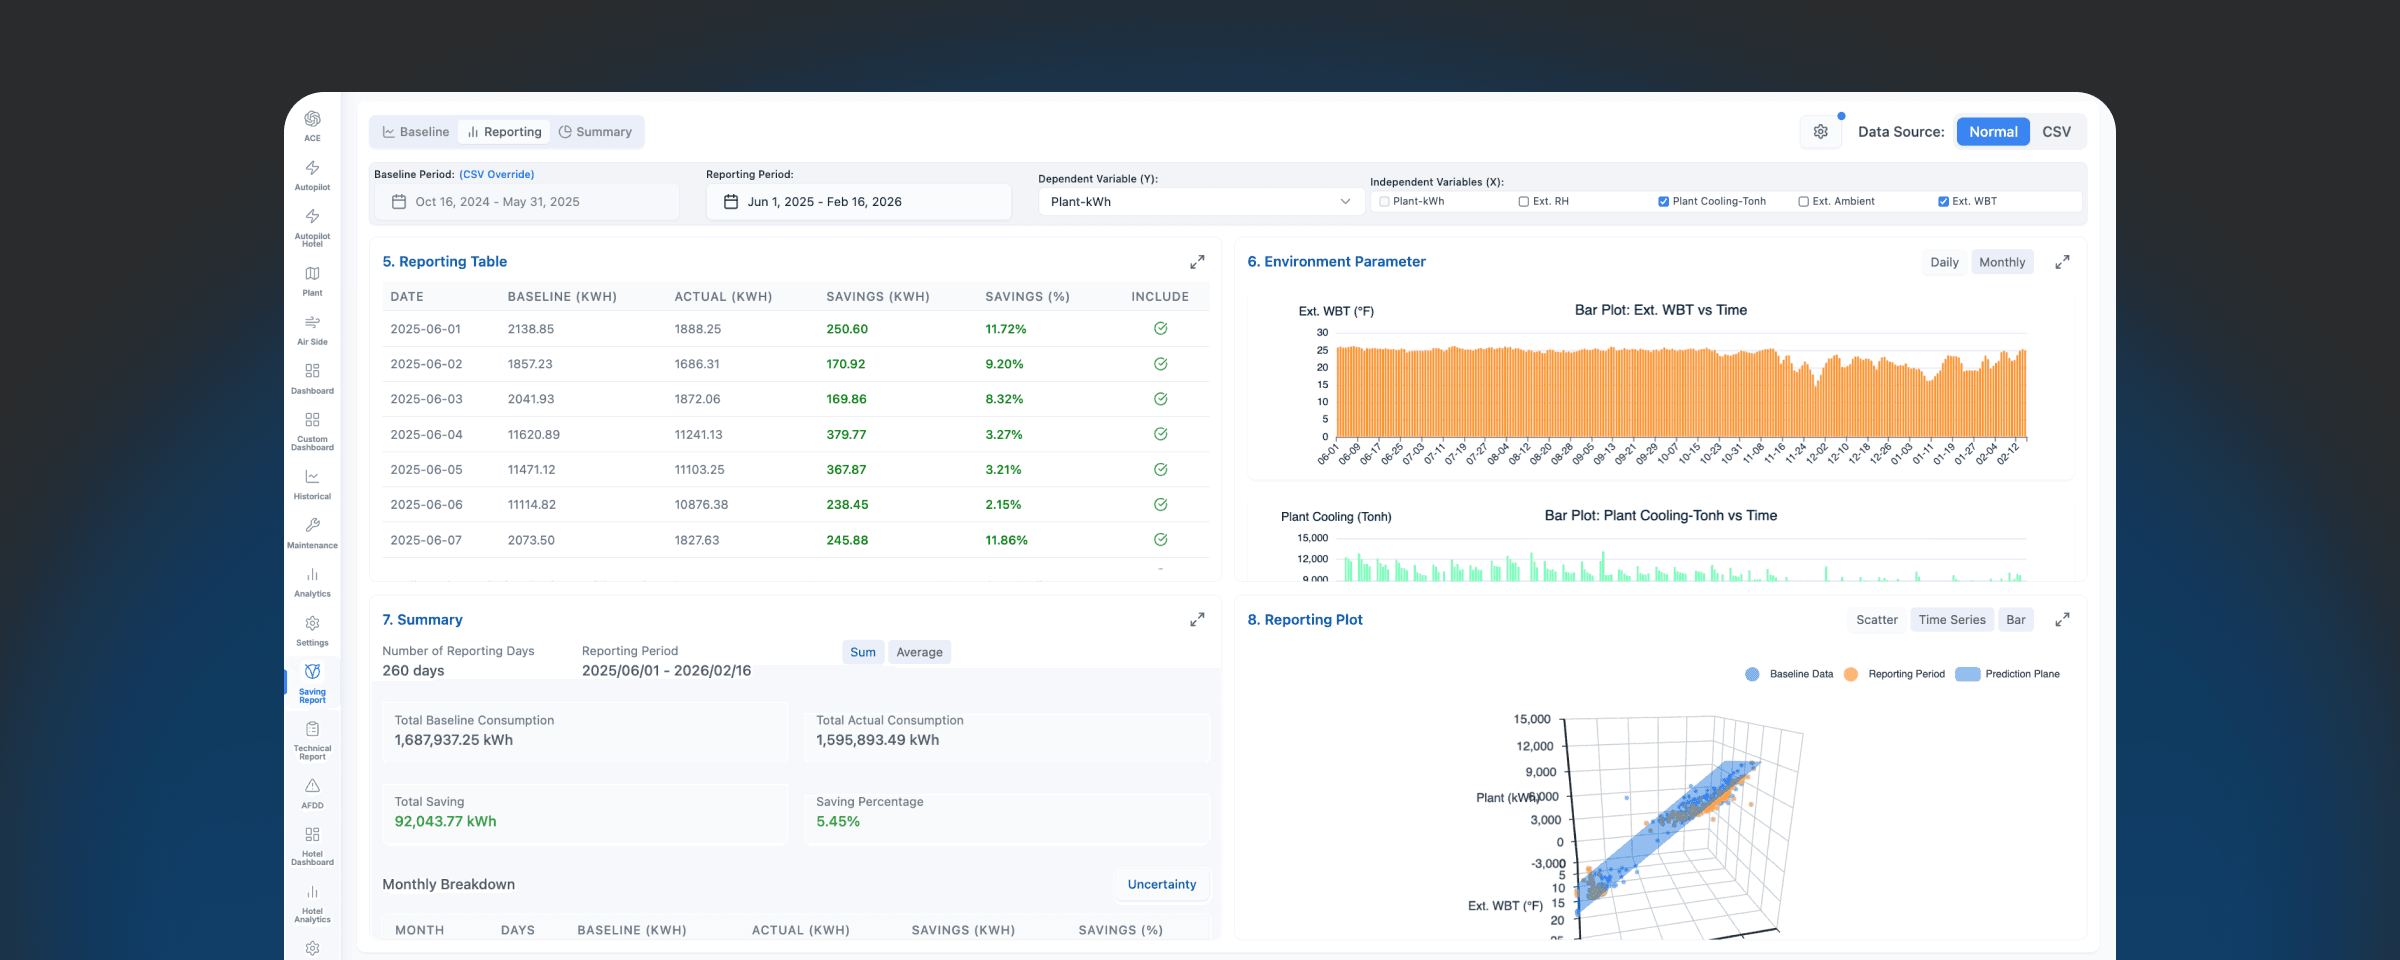
An interactive plant map gives operators live status on every chiller, pump and cooling tower, with per-chiller detail cards. Fault detection, automated reporting and IPMVP-based savings verification make plant performance transparent and defensible.
Share a few details about your upcoming event. Our sustainability team will recommend the right measurement, reporting and attendee-engagement approach.